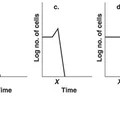
Which graph in Figure 7.3 best depicts the effect of placing the culture in an autoclave for 15 min. at time x?
A) a
B) b
C) c
D) d
E) e
Answer: B) b
You might also like to view...
The level of the oceans is rising due to:
a. ozone depletion. b. global warming. c. lost species biodiversity. d. increased precipitation. e. acid rain.
Symptoms of PMS are caused by
a. uterine lining separation and expulsion during the period. b. the hormone aldosterone causing more absorption of sodium. c. lack of exercise causing hormonal changes. d. lack of sunlight limiting hormone production. e. all of these.
The layers of connective tissue that protect the brain are the
a. meninges. b. epithelial segments. c. palisade layers. d. xylem. e. cambium layers.
Graves disease is an autoimmune disorder in which a person's thyroid is stimulated to produce too much thyroxine
Indicate whether the statement is true or false