Use a graphing calculator to plot the data and find the quadratic function of best fit.An engineer collects data showing the speed s of a given car model and its average miles per gallon M. Use a graphing calculator to plot the scatter diagram. What is the quadratic function of best fit?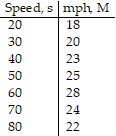
A. M(s) = 0.063x2 + 0.720x + 5.142
B. M(s) = -0.0063x2 + 0.720x + 5.142
C. M(s) = -6.309x2 + 0.720x + 5.142
D. M(s) = -0.631x2 + 0.720x + 5.142
Answer: B
Mathematics
You might also like to view...
Solve for the missing number. =
= 
A. 0.17 B. 1.5 C. 6 D. 3
Mathematics
Solve the problem.There is a 3-degree drop in temperature for every thousand feet that an airplane climbs into the sky. If the temperature on the ground is 41 degrees, what will be the temperature when the plane reaches an altitude of 20,000 feet?
A. 19 degrees
B.  degrees
C.  degrees
D. 21 degrees
Mathematics
Simplify.-3(6 - 10)2 - 2(4 - 6)3
A. 64 B. -32 C. -64 D. 32
Mathematics
Write the number in scientific notation.0.000004045
A. 4.045 x 10⁶ B. 4.045 x 10⁻⁷ C. 4.045 x 10⁻⁵ D. 4.045 x 10⁻⁶
Mathematics