Use the graph to determine the x- and y-intercepts.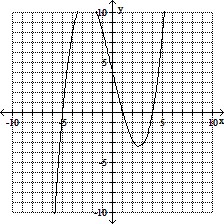
A. x-intercept: 4; y-intercepts: -4, 1, 5
B. x-intercepts: 4, 1, -5; y-intercept: 4
C. x-intercept: 4; y-intercepts: 4, 1, -5
D. x-intercepts: -4, 1, 5; y-intercept: 4
Answer: B
You might also like to view...
Estimate the indicated probability.The table shows the number of college students who prefer a given pizza topping.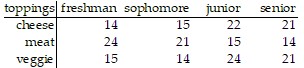 Determine the empirical probability that a student prefers meat toppings. Round to the nearest thousandth.
A. 0.336 B. 0.324 C. 0.109 D. 0.327
Solve.At Allied Electronics, production has begun on the X-15 Computer Chip. The total revenue function is given by 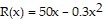 and the total profit function is given by
 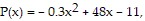 where x represents the number of boxes of computer chips produced. The total cost function, C(x), is such that
 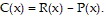 Find C(x).
A. C(x) = 2x + 11 B. C(x) = 3x + 16 C. C(x) = 4x + 7 D. C(x) = -0.3x2 + 4x + 11
Solve the problem.The formula  is used in electrical engineering. The variables I, V, and Z are complex quantities. Find V for the given values of I and Z, and express the answer in standard form.
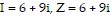
A. -45 - 108i B. 108 - 45i C. 108 + 45i D. -45 + 108i
Solve the problem.The rates of death (in number of deaths per 100,000 population) for 1-4 year olds in the United States between 1980-1995 are given below. (Source: NCHS Data Warehouse) 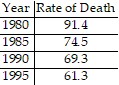 A logarithmic equation that models this data is y = 822.99 - 167.55 ln x where x represents the number of years since 1900. Use this equation to predict the rate of death for 1-4 year olds in 2005.
What will be an ideal response?