If the firm in the given graph were to maximize profits, it would:
These are the cost and revenue curves associated with a firm.
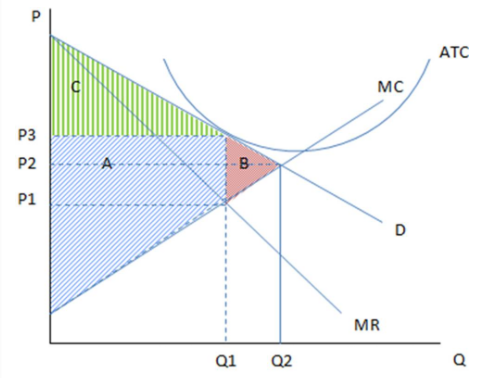
A. produce Q1 and charge P3.
B. cause deadweight loss.
C. earn zero economic profits.
D. All of these statements are true.
D. All of these statements are true.
You might also like to view...
An increase in the money supply is likely to reduce
A. money demand. B. interest rates. C. the general price level. D. nominal income.
A subsidy to buyers has been placed on the market in the graph shown. What is the amount of the subsidy per unit of this good?
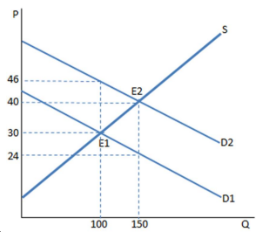
A. $22
B. $16
C. $10
D. $6
An increase in the supply of oranges in a town drives down its price by 5 percent. Which of the following changes will be observed in the market?
a. The demand for oranges will decrease. b. The demand for oranges will increase. c. The quantity of oranges demanded will increase. d. The quantity of oranges demanded will decrease.
If a price ceiling is imposed above the equilibrium price, what is the effect?
a. There is no visible effect on the market outcome. b. A shortage results. c. A surplus results. d. The quantity demanded will decrease.