Refer to the diagram. A government-set price floor is best illustrated by:
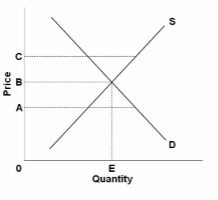
A. price A.
B. quantity E.
C. price C.
D. price B.
C. price C.
You might also like to view...
Refer to Figure 4-5. The figure above represents the market for pecans. Assume that this is a competitive market. If the price of pecans is $9, what changes in the market would result in an economically efficient output?
A) The price would decrease, the demand would increase, and the supply would decrease. B) The quantity supplied would increase, the quantity demanded would decrease, and the equilibrium price would decrease. C) The price would decrease, the quantity supplied would decrease, and the quantity demanded would increase. D) The price would increase, the quantity demanded would decrease, and the quantity supplied would increase.
If the wage is fixed at $8 per hour, the total labor cost of employing four workers for 8 hours is
a. $8 b. $32 c. $64 d. $256 e. $2,048
When the Fed lowered the discount rate in late 2008, the action was ultimately designed to:
A. decrease the monetary base. B. increase the money supply. C. increase the prime rate. D. increase the reserve requirement.
Workers do not know the safety records at individual firms; they only know industry averages. As a result,
A) each firm tries to outdo each other in making safety improvements. B) each firm has the incentive to be the safest in its industry. C) the equilibrium level of safety is less than optimal. D) the optimal level of safety is achieved.