Solve the problem.The one-day temperatures for 12 world cities along with their latitudes are shown in the table below. Make a scatter diagram for the data. Then find the line of best fit and graph it on the scatter diagram.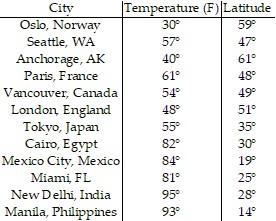 Latitude (degrees)
 Temperature (F)°
What will be an ideal response?
Latitude (degrees)
Temperature (F)°
Line of best fit = -0.68x + 82.91
Mathematics
You might also like to view...
Match the system of inequalities with the appropriate graph.2x + y ? 4 x - 1 ? 0
A. 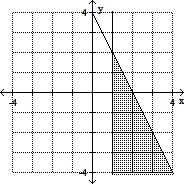
B. 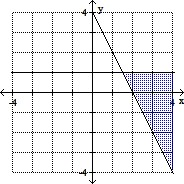
C. 
D. 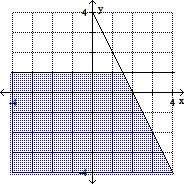
Mathematics
Solve the equation.
?

What will be an ideal response?
Mathematics
Solve. log5 x + 9 = 8
A. - 
B. 125
C. -125
D. 
Mathematics
Use the fundamental identities to simplify the expression.sin ? cos ? sec ? csc ?
A. tan2? B. 1 C. csc2? D. sec2?
Mathematics