The bar graph below shows the temperatures recorded as the high temperature in Little City on Brianna's birthday for the indicated years. 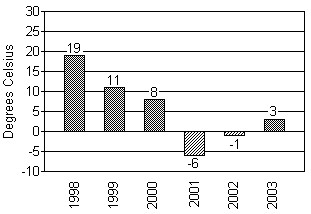 In which year was the recorded temperature the highest?
A. 2002
B. 2003
C. 1998
D. 2001
Answer: C
You might also like to view...
Label the pair of statements as either contrary or consistent.The computer is not working right.The computer is broken.
A. Contrary B. Consistent
Solve the problem using the quadratic formula.The cumulative number (in thousands) of deaths from a certain disease from 2000 to 2010 is modeled by  where x = 0 corresponds to 2000, x = 1 to 2001, etc. Use the formula for A to estimate symbolically the year when the total number of deaths reached 100 thousand.
A. 2008 B. 2005 C. 2007 D. 2006
Use Bayes' rule to find the indicated probability.Quality Motors has three plants. Plant 1 produces 35% of the car output, plant 2 produces 20% and plant 3 produces the remaining 45%. One percent of the output of plant 1 is defective, 1.8% of the output of plant 2 is defective and 2% of the output of plant 3 is defective. The annual total production of Quality Motors is 1,000,000 cars. A car chosen at random from the annual output and is found defection. What is the probability that it came from plant 2?
A. 0.35 B. 0.559 C. 0.224 D. 0.217
Identify the quadrant in which the point is located.
A. Quadrant III B. Quadrant IV C. Quadrant I D. Quadrant II