Provide an appropriate response.
Which table represents the frequency distribution for the given ages of students in a technical mathematics class: 42, 18, 19, 20, 23, 36, 18, 25, 20, 20, 24, 22, 26, 29, 37, 20, 20, 27, 42, 51, 24, 45, 24, 18, 31.
A. 
B. 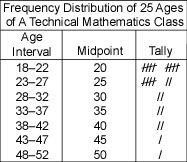
C. 
D. 
Answer: D
You might also like to view...
Use the given transformation to evaluate the integral.  FIGURE 1.png) xy dA, where R is the region in the first quadrant bounded by the lines y = x, y = 3x and the hyperbolas xy = 2, xy = 4; x =
xy dA, where R is the region in the first quadrant bounded by the lines y = x, y = 3x and the hyperbolas xy = 2, xy = 4; x =  figures 4.png) , y = v.
, y = v.
What will be an ideal response?
Write the number in scientific notation.In 1997, the total value of imports and exports for France was $36,700,000,000.
A. $3.67 × 10¹¹ B. $3.67 × 10⁹ C. $367 × 108 D. $3.67 × 10¹⁰
For the graph of the function y = f(x), find the absolute maximum and the absolute minimum, if it exists.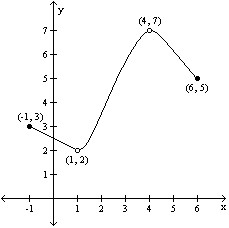
A. Absolute maximum: f(4) = 7; Absolute minimum: f(1) = 2 B. Absolute maximum: f(4) = 7; Absolute minimum: none C. Absolute maximum: none; Absolute minimum: none D. Absolute maximum: none; Absolute minimum: f(1) = 2
Solve the proportion. =
= 
A. 
B. 
C. 
D. 