Graph the function. Specify the intervals over which the function is increasing and the intervals where it is decreasing.y = 
A. Increasing -? < x < 0 and 0 < x < ?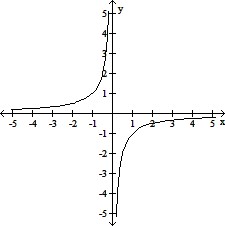
B. Decreasing -? < x < 0 and 0 < x < ?
C. Increasing -? < x < 0
Decreasing 0 < x < ?
D. Decreasing -? < x < 0
Increasing 0 < x < ?
Answer: B
You might also like to view...
Complete the ordered pairs. Then graph the equation.y - 1 = x(0, ), ( , 0), (3, )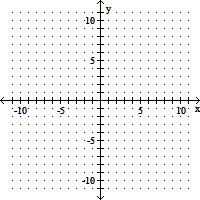
A. (0, 1), (-1, 0), (3, 4)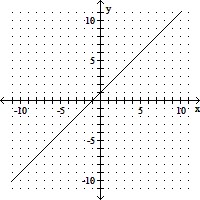
B. (0, 1), (1, 0), (3, -2)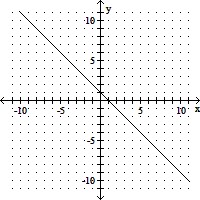
C. (0, -1), (-1, 0), (3, -4)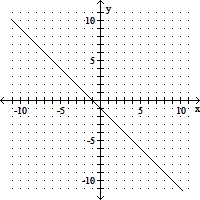
D. (0, -1), (1, 0), (3, 2)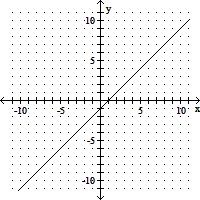
Use the horizontal line test to determine whether the function is one-to-one.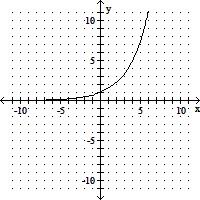
A. No B. Yes
Insert "?" or "?" in the blank to make the statement true.? ?
A. ? B. ?
Use the given information to answer the question.The number N, in millions of Americans of age x with arthritis, is estimated with the following graph. 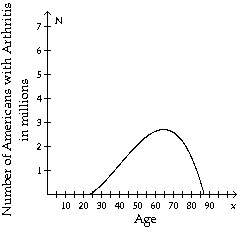 Approximately how many 40-year-olds and 55-year-olds combined have arthritis?
A. 31,400,000 B. 400,000 C. 4,100,000 D. 3,600,000