Refer to the information provided in Table 24.2 below to answer the question(s) that follow. Table 24.2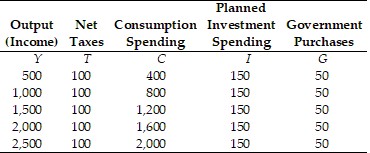 Refer to Table 24.2. The equilibrium level of output is ________ billion.
A. $1000
B. $1,500
C. $2,000
D. $2,500
Answer: A
You might also like to view...
A decrease in the level of real GDP in the economy leads to
A) a leftward shift in the demand for money curve. B) a rightward shift in the demand for money curve. C) a leftward movement along the demand for money curve. D) a rightward movement along the demand for money curve.
The full opportunity costs of production are calculated as the sum of both explicit and implicit costs
Indicate whether the statement is true or false
Empirical observations validate that the Gini co-efficient for the U.S. economy was between 0.35 and 0.37 until the 1990s, after which it has increased and reached 0.469 in 2009 . Which of the following can be inferred from this?
a. The distribution of national income in the U.S. has become slightly more equal since the 1990s. b. The government spending on poverty alleviation has increased since 1990. c. More jobs have been created in the U.S. since 1990. d. The distribution of national income in the U.S. has become slightly more unequal since the 1990s. e. The government has replaced the existing regressive tax structure with a progressive tax structure.
Over many years the capital stock in the United States has grown to approximately
A. $40 trillion. B. $90 trillion. C. $20 trillion. D. $80 trillion.