The graph below shows the approximate annual percentage growth rate in world population for the years 1960 through 2010. Data is estimated by the UN Census Bureau.Annual Growth Rate (Percentage) 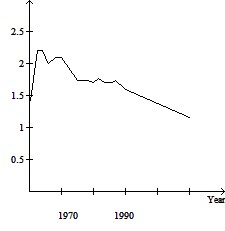 Use the graph to answer the question.How does world population in 1978 compare to world population in 1977?
A. It is the same
B. It is 1.75% less
C. It is 1.75% greater
D. It is 1.75 million greater
Answer: C
Mathematics
You might also like to view...
Find the length of the curve.32xy2 - 4y6 = 8 between y = 1 to y = 4
A. 
B. 
C. 
D. 
Mathematics
Change the given quantity to the indicated unit.96 mg =  mcg
mcg
A. 0.96 B. 9600 C. 0.096 D. 96,000
Mathematics
Verify the identity. = csc x cot x
What will be an ideal response?
Mathematics
Find the sum of the sequence.
A. 54 B. 108 C. 36 D. 72
Mathematics