Use a graphing utility to find the equation of the line of best fit. Round to two decimal places, if necessary.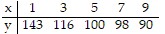
A. y = -6.8x + 150.7
B. y = 6.8x - 150.7
C. y = -6.2x + 140.4
D. y = 6.2x - 140.4
Answer: C
You might also like to view...
Answer as requested.Which of the following pairs of variables is likely to have no correlation?
A. The unemployment rate and the number of home foreclosures B. The amount of rainfall and the height of the grass C. The annual rainfall in Tempe, Arizona and the annual cost of tuition at Yale University D. The amount of time studying math and grade on a math test
Factor completely.18x2 - 2
A. (3x + 1)(6x - 2) B. 2(3x + 1)(3x - 1) C. 2(3x - 1)2 D. (6x + 2)(3x - 1)
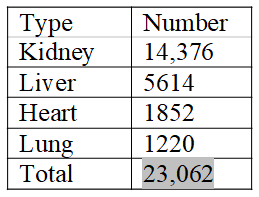
The following lists the number of organ transplants given in 2006. Use this data to construct a pie chart.
Solve the system of equations by graphing. If the system is inconsistent or the equations are dependent, say so.3x + y = 183x + y = 33
A. {(x, y)|3x + y = 18} (dependent equations) B. {(15, -27)} C. {(9, 9)} D. ? (inconsistent system)