Select the graph below that best shows the change in the market specified in the following situation: In the market for Florida oranges, when a major frost damages the orange crop in California
Assume that the graphs show a competitive market for the product stated in the question.
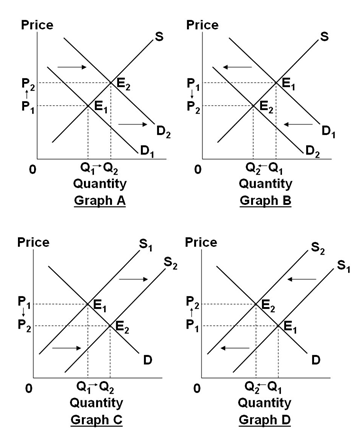
A. Graph A
B. Graph B
C. Graph C
D. Graph D
A. Graph A
You might also like to view...
Suppose a price index is formed to measure changes in the price level between 1999 to 2005. A price index based on changes in the cost of the basket of goods purchased by the typical consumer in 2005 is called a
a. relative price index. b. consumer price index. c. Laspeyres price index. d. Paasche price index.
The presence of different technologies can allow greater efficiency because one technology is better at peak times and the other is better at all times
Indicate whether the statement is true or false
Due to capacity constraints, the price elasticity of supply for most products is:
A) the same in the long run and the short run. B) greater in the long run than the short run. C) greater in the short run than in the long run. D) too uncertain to be estimated.
If the real exchange rate is 5/4 pounds of Chilean beef per pound of U.S. beef, a pound of U.S. beef costs $2 and the nominal exchange rate is 500 Chilean pesos per dollar, then Chilean beef costs
a. 1,250 pesos per pound. b. 800 pesos per pound c. 250 pesos per pound. d. None of the above is correct.