Solve the problem.The following data represents the normal monthly precipitation for a certain city in Arkansas.  Draw a scatter diagram of the data for one period. Find the sinusoidal function of the form
  that fits the data. Draw the sinusoidal function on the scatter diagram. Use a graphing utility to find the sinusoidal function of best fit. Draw the sinusoidal function of best fit on the scatter diagram.
What will be an ideal response?
y = 2.17 sin (0.49x - 1.88) + 6.02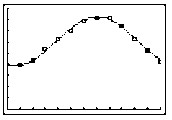
Mathematics
You might also like to view...
Find the focus and directrix of the parabola.y2 - 16x = 0
A. (4, 0); x = 4 B. (0, 4); y = -4 C. (4, 0); x = -4 D. (4, 0); y = -4
Mathematics
Solve for the specified variable.RI = kE, for R
A. 
B. R = kEI
C. R = kE - I
D. R = 
Mathematics
Perform the indicated operations, expressing the answer in simplest form with rationalized denominators.
A. 
B. 
C. 
D. 
Mathematics
Solve the problem.Let A =  and B =
  . Find
A. 
B. 
C. 
D. 
Mathematics