Refer to the graph shown which shows total product. At point B: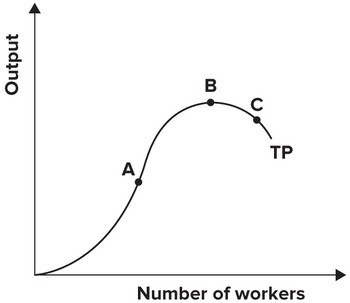
A. marginal product is at its minimum.
B. marginal product is zero.
C. marginal product is at its maximum.
D. average product is at its maximum.
Answer: B
You might also like to view...
Alpha can produce either 18 tons of oranges or 9 tons of apples in a year, while Omega can produce either 16 tons of oranges or 4 tons of apples. Which of the following exchange rates between apples and oranges would allow both Alpha and Omega to gain by specialization and exchange?
a. 1 ton of oranges for 1/3 of a ton of oranges b. 1 ton of apples for 3 1/3 tons of oranges c. 1 ton of apples for 2 tons of oranges d. 1 ton of oranges for 0.4 tons of apples
Say at the current output level marginal costs = $20 and the average total cost = $10. From this information we know that the
A. average total costs are increasing. B. average total costs are decreasing. C. marginal costs are decreasing. D. marginal costs are increasing.
Suppose Acme and Mega produce and sell identical products and face zero marginal and average cost. Below is the market demand curve for their product.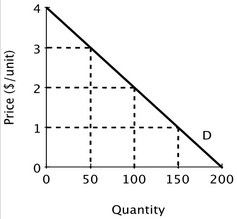 If Acme and Mega decide to collude and work together as a monopolist with each firm producing half the quantity demanded by the market at the monopoly price, then what will be Mega's economic profit?
A. $100 B. $50 C. $150 D. $0
Stricter environmental regulations and increased demand for energy have caused an increase in the demand for relatively clean natural gas. In the last several years, improved extraction technologies and new discoveries have increased the availability of natural gas. What has been the net effect on price and quantity for natural gas?
A. Quantity sold rose while the effect on price is ambiguous. B. Quantity sold fell and the effect on price is ambiguous. C. Quantity sold and price both rose with certainty. D. Quantity sold and price both fell with certainty.