Construct a histogram of the given frequency distribution.The frequency distribution indicates the test averages of a group of 840 students.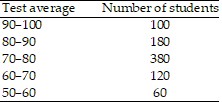
A. 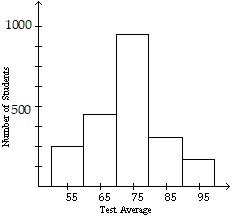
B. 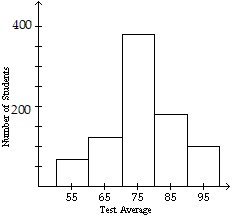
C. 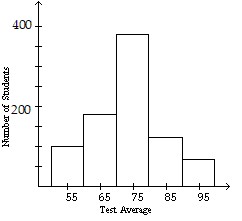
D. 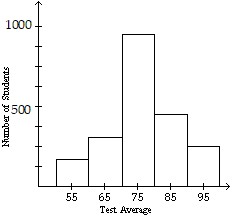
Answer: B
You might also like to view...
You leave your apartment at 10:00 am and take a leisurely stroll to get lunch at a pizza place that is 2500 yards west of your home. You have lunch there from 12:00 to 1:00 pm. You return home, arriving at 2:00 pm, and take a one-hour nap. Then you go to a friend's house, which is east of your home. You stay there from 4:00 pm on. Make a graph of distance west from your home versus time. Be sure to label your graph appropriately.
What will be an ideal response?
Provide an appropriate response.Which class has the highest enrollment over the given time period? 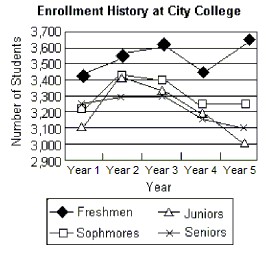
A. Freshmen B. Sophomores C. Juniors D. Seniors
Solve the problem.The image of a figure under the translation that takes P to P' is shown. Find the original figure. Note again, the given figure is the image after translation.
A. 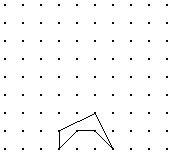
B. 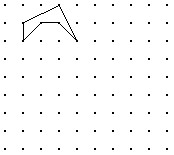
C. 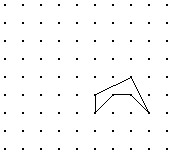
D. 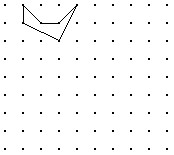
Subtract. Check by adding. 
A. 107,284 B. 42,716 C. 57,284 D. 106,046