The graph below shows the percentage of students enrolled in the College of Engineering at State University. Use the graph to answer the question.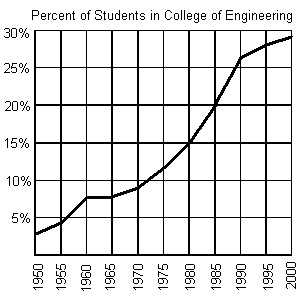 Does the graph represent a function?
A. yes
B. no
Answer: A
You might also like to view...
Decide whether or not the events are mutually exclusive.Events A and B defined as followsEvent A is that at least three of Toni's five cousins are female. Event B is that at least three of Toni's five cousins are male.
A. No B. Yes
Find the present value. Round to the nearest cent.To get $10,000 after 4 years at 18% compounded monthly
A. $8363.87 B. $4893.62 C. $2500.00 D. $11,956.18
Solve the problem.The cost of tuition at a community college is given by C(x) = 490 + 54x, where x is the number of credit hours. Interpret the slope of this function as a rate of change.
A. The tuition at the community college increases by $490 for each additional 54 credit hours. B. The number of credit hours increases by 54 for each increase of $490 in tuition. C. The tuition at the community college increases by $490 for each additional credit hour. D. The tuition at the community college increases by $54 for each additional credit hour.
The figure shows a walkway with a handrail. Angle ? is the angle between the walkway and the horizontal, while angle ? is the angle between the vertical posts of the handrail and the walkway. Assume that the vertical posts are perpendicular to the horizontal.
?
 ?
Find ? if ? = 52°.
?
?
Find ? if ? = 52°.
?
A. ? = 57° B. ? = 123° C. ? = 38° D. ? = 128° E. ? = 52°