Provide an appropriate response.Six different candidates are running for president of the board of a nonprofit organization. By conducting a poll, you estimate the percentage of people who plan to vote for each candidate. One candidate, Maria Gonzales, has a substantial lead. To win, a candidate must have a simple majority (more than 50% of the vote). Suppose you wish to display the data in a graph. From your graph, it should be easy to tell whether Maria Gonzales has more than 50% of the vote. Which graph would be more useful, a bar graph or a circle graph? Explain your answer.
What will be an ideal response?
Answers will vary. Possible answer: A circle graph would be more useful. Circle graphs are useful for showing what proportion of a population falls in each category. One would see at a glance whether Maria Gonzales had more than 50% of the vote. Bar graphs are useful for comparisons among different categories but not as useful for showing what proportion falls in each category.
You might also like to view...
Find the x-intercepts and then sketch the graph.f(x) = x(x + 10)(x - 2)
A. (0, 0), (2, 0), (10, 0)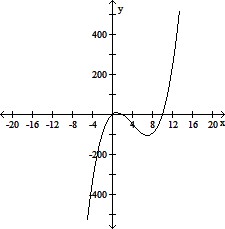
B. (-10, 0), (0, 0), (1, 0)
C. (-10, 0), (0, 0), (2, 0)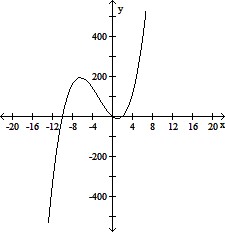
D. (-2, 0), (0, 0), (10, 0)
Solve the formula for the indicated variable.L =  for k
for k
A. k = 
B. k = 
C. k = 2WL2
D. k = 
Use the graph to answer the question.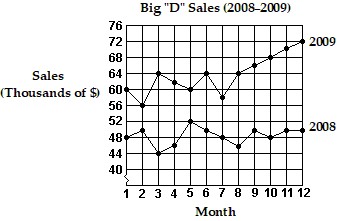 Which month in 2008 had the lowest sales?
A. Month 2 B. Month 6 C. Month 3 D. Month 8
Simplify. Assume that variables can represent any real number.
A. 7t
B. 24
C. 7
D. 7t2