Determine the slope, if it exists, of the graph of the given linear equation.x = 8
A. not defined
B. m = -8
C. m = 0
D. m = 8
Answer: A
You might also like to view...
Construct a boxplot for the given data. Include values of the 5-number summary in all boxplots.The test scores of 32 students are listed below. Construct a boxplot for the data set.32 37 41 44 46 48 53 5557 57 59 63 65 66 68 6970 71 74 74 75 77 78 7981 82 83 86 89 92 95 99
A. 
B. 
C. 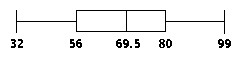
D. 
Determine the number of terms and name the coefficients of the terms.x4
A. 1; 4 B. 1; 1 C. 0 D. 1; 0
Solve for x, where x is a real number.3x = 27
A. 9 B. 4 C. 3 D. 2
Determine whether or not the function is linear. If it is, determine the slope and interpret it.The population of a small town is given by P(t) = 59t + 12,350, where t is the number of years past 2010.
A. Linear; 59; Each year since 2010, the population decreased by 59 people. B. Not linear C. Linear; 12,350; Each year since 2010, the population increased by 12,350 people. D. Linear; 59; Each year since 2010, the population increased by 59 people.