If the firm in the given graph were to produce Q1 and charge P3, the area C would represent:
These are the cost and revenue curves associated with a firm.
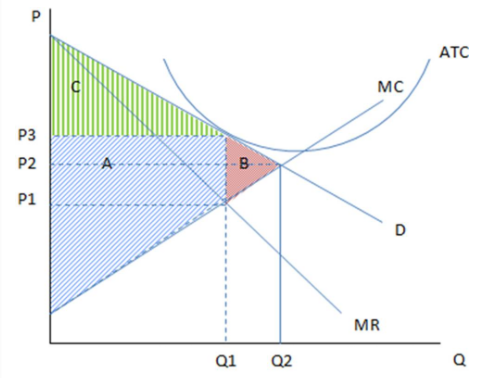
A. producer surplus.
B. consumer surplus.
C. deadweight loss.
D. profits.
B. consumer surplus.
You might also like to view...
Although imperfect, which of the following is used as a measure of the standard of living?
A) real GDP ÷ population B) real GDP × population C) nominal GDP × population D) nominal GNP ÷ population E) nominal GNP × population
Suppose a graph with Ron's weight on the vertical axis and his consumption of ice cream on the horizontal axis indicated that for each serving of ice cream he ate, Ron would gain 3 pounds, regardless of how much ice cream he had already eaten. This graph would show a
a. horizontal line at weight = 3 b. straight line with slope = 3 c. straight line with slope = 1/2 d. straight line with slope = -3 e. straight line with slope = -1/3
The shape of an experience curve suggests that
A) specialization does not matter. B) learning does not pay. C) experience can lower costs. D) none of these choices.
If market incentives to produce are too strong, the market will end up producing:
A) too much of the good. B) too little ofthe good. C) a quantity equal to the efficient outcome, as market incentives can never be considered too strong. D) zero output