Use the following diagram to answer the next question. 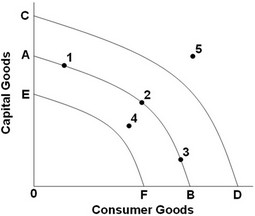 Assume a nation's current production possibilities are represented by the curve AB in the above diagram. Economic growth would best be indicated by a
A. shift in the curve from AB to CD.
B. movement from point 3 to point 4.
C. shift in the curve from AB to EF.
D. movement from point 1 to point 2.
Answer: A
You might also like to view...
The law of supply states that, other things remaining the same,
A) demand increases when supply increases. B) if the price of a good increases, firms buy less of it. C) if the price of a good increases, the quantity supplied increases. D) as people's income increase, the supply of goods increases. E) if the price of a good increases, the supply increases.
The Lerner Index is derived from the profit-maximizing condition of a firm
Indicate whether the statement is true or false
Given the information in Figure 14.4, the monopsony wage rate is:
A) W1. B) W2. C) W3. D) W4. E) none of the above
Which of the following would cause the U.S. money supply to expand?
a. a commercial bank using excess reserves to extend a loan to a customer b. a commercial bank purchasing U.S. securities from the Fed as an investment c. an increase in reserve requirements d. an increase in the discount rate