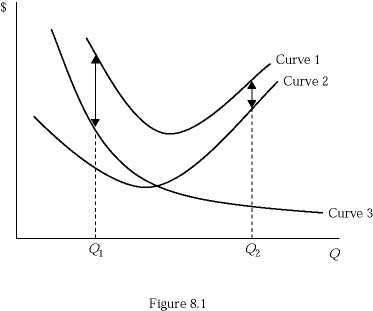
 Refer to Figure 8.1, which shows a family of average cost curves. The average fixed cost curve is represented by:
A. Curve 1.
B. Curve 2.
C. Curve 3.
D. the vertical sum of curve 1 and curve 2.
Answer: C
You might also like to view...
Refer to Figure 9-2. Without the tariff in place, the United States consumes
A) 9 million pounds of rice. B) 15 million pounds of rice. C) 31 million pounds of rice. D) 42 million pounds of rice.
As the interest rate increases, what happens to the present value of a future payment? Explain why changes in the interest rate will lead to changes in the quantity of loanable funds demanded and investment spending
A fashion fad significantly increases the demand for fedora hats. Which of the following would most likely be the result?
a. The price of fedoras would plummet. b. The production of fedoras would decline. c. Sellers would discount the price of their existing supply of fedoras. d. Buyers would compete fiercely to buy a limited quantity of fedoras.
Use the table below to answer the next question.YearEmployedStructuralFrictionalCyclicalUnemployed20031,800501005020020042,400100100 30020052,000 15018050020062,66040 0140Determine the number of people structurally unemployed for the year 2005.
A. 220 B. 170 C. 150 D. 0