Solve the problem.The table shows the population of a certain city for selected years between 1950 and 2003. 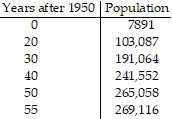 By using your calculator to find the logistic regression equation that best fits the data, determine when the population of the city will first exceed 271,000.
A. In 2018
B. In 2012
C. In 2015
D. In 2010
Answer: C
You might also like to view...
Add.-42 + (-6)
A. 48 B. -48 C. -36 D. 36
Find the area of the region specified in polar coordinates.one petal of the rose curve r = 4 sin 2?
A. 8?
B. 2?
C.  ?
?
D. 4?
Rewrite the expression using the Distributive Property and simplify the result.-6 ? (7y + 3)
A. -126y B. -42y + 3 C. 7y - 18 D. -42y - 18
Solve the problem.The arch beneath a bridge is semi-elliptical, a one-way roadway passes under the arch. The width of the roadway is 34 feet and the height of the arch over the center of the roadway is 9 feet. Two trucks plan to use this road. They are both 8 feet wide. Truck 1 has an overall height of  and Truck 2 has an overall height of
  . Draw a rough sketch of the situation and determine which of the trucks can pass under the bridge.
A. Truck 1 can pass under the bridge, but Truck 2 cannot. B. Truck 2 can pass under the bridge, but Truck 1 cannot. C. Both Truck 1 and Truck 2 can pass under the bridge. D. Neither Truck 1 nor Truck 2 can pass under the bridge.