For a given seller, the figure below shows the relationship between the number of units produced and the opportunity cost of producing an additional unit of output. As the market price of this good increases, the quantity produced by this seller will ________. 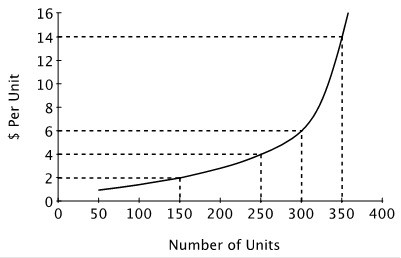
A. increase
B. stay the same
C. stay the same until the price rises above $6 per unit, and then it will increase
D. decrease
Answer: A
You might also like to view...
Assume that an individual spends his income on sweaters and shirts. If the price of a sweater increases:
A) the opportunity cost of buying sweaters increases. B) the opportunity cost of buying sweaters decreases. C) the opportunity cost of buying shirts increases. D) There is no change in the opportunity cost of consuming either good.
Consider the hypothetical supply and demand of Kidneys.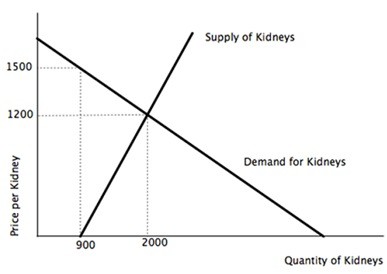 Initially, kidneys are exchanged by donations only (price=0). If the government decides to legalize kidney sales and the market reaches equilibrium, then:
A. consumer surplus remains the same. B. total surplus increases. C. a shortage of kidneys will arise. D. producer surplus remains the same.
The owner of a health club asks you for advice about whether the company should raise or lower the price of its membership this year based on the following information: last year the club raised the price of its membership by 5% and the number of
members paying the same fee fell by 7%. Please provide the best answer for the statement.
Over the last hundred years,
A) movements in output due to recessions and recoveries dominate the movement caused by long-run growth. B) output has decreased in as many years as it has increased. C) U.S. output has approximately doubled. D) all of the above E) none of the above