Table 11-1
Y =
C + I + G
C =
500 + 0.8(Y?T)
I =
300
G =
700
T =
0.25Y
Refer to Table 11-1. What is the level of tax revenues in this model?
A. 1,000
B. 950
C. 945.5
D. 937.5
E. 437.5
Answer: D
You might also like to view...
In the United States the distribution of income is relatively unequal, and output is relatively high, while in the former Soviet Union the distribution of income was more equal and output per worker was much lower. Give one possible explanation for this phenomenon.
What will be an ideal response?
Government-imposed quantity restrictions
A) generate a higher price for the good than would prevail under freely competitive markets. B) generate a lower price for the good than would prevail under freely competitive markets. C) does not affect the price of the good because quantity restrictions always ban sale of the good completely. D) can cause prices to either be higher or lower, but always cause excess quantities supplied to develop.
The short-run average total cost (ATC) curve of a firm will tend to be U-shaped because
a. larger firms always have lower per-unit costs than smaller firms. b. at low levels of output, AFC will be high, while at high levels of output, MC will be high as the result of diminishing returns. c. diminishing returns will be present when output is small, and high AFC will push per-unit cost to high levels when output is large. d. diseconomies of scale will be present at both small and large output rates.
Figure 11-3
?
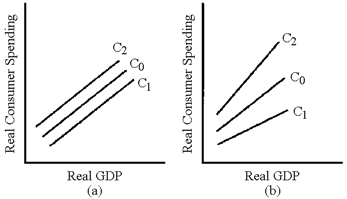 In Figure 11-3, which line represents the change in the consumption schedule caused by a cut in the personal income tax as advocated by President George W. Bush in 2001?
A. C1 in graph (a) B. C2 in graph (a) C. C1 in graph (b) D. C2 in graph (b)