Refer to the above graphs. A price increase from $20 to $40 causes quantity demanded to decrease from 100 units to 50 units. Which graph best illustrates the price elasticity of demand for this good?
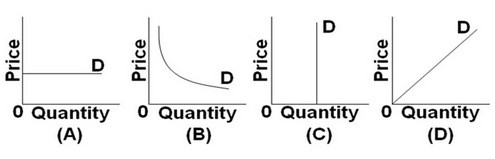
A. Graph A
B. Graph B
C. Graph C
D. Graph D
Answer: B. Graph B
You might also like to view...
That part of disposable income not spent on consumption is defined as:
a. transitory disposable income. b. permanent disposable income. c. disposable income. d. autonomous consumption. e. saving.
Compute the tax rates for the three taxpayers shown in Table 33.1. Then use the table to answer the indicated question.TaxpayerIncome (Dollars)Taxable Income (Dollars)Taxes Paid (Dollars)Effective Tax Rate(Percent)Nominal Tax Rate(Percent)1$200,000$100,000$6,000________%________%2100,00080,0008,000________%________%360,00048,00012,000________%________%In Table 33.1, the effective tax rate for taxpayer 3 is
A. 20.0 percent. B. 5.0 percent. C. 25.0 percent. D. 8.0 percent.
Using the information in the table, what is the value of gross investment?ConsumptionGross InvestmentGovt. PurchasesNet ExportsNominal GDP$9 trillion $3 trillion-$1 trillion$14 trillion
A. $4 trillion B. $1 trillion C. $3 trillion D. $2 trillion
Starting from long-run equilibrium, a large decrease in government purchases will result in a(n) ________ gap in the short-run and ________ inflation and ________ output in the long-run.
A. expansionary; lower; potential B. expansionary; higher; potential C. recessionary; lower; potential D. recessionary; lower; lower