This graph depicts the demand for a normal good.
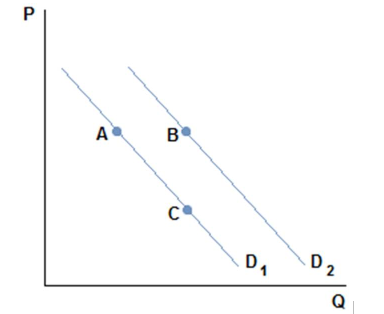
A shift from A to B in the graph shown for a normal good might be caused by:
A. an increase in price.
B. a decrease in price.
C. an increase in income.
D. a decrease in income.
C. an increase in income.
You might also like to view...
Which of the following will cause an increase market supply?
A. An increase in the price of the good. B. An increase in demand for the good. C. A technological innovation that lowers the marginal cost of producing the good. D. A decrease in the number of firms in the market.
Tariffs create deadweight losses and destroy wealth, whereas quotas increase cooperative surplus and create wealth
Indicate whether the statement is true or false
One of the business revolutions of the 1980s is "just in time" inventory, a system where businesses estimate their requirements for raw materials and keep no more on hand than is necessary to complete that period's production. What affect did the change to "just in time" inventory have on short-term supply elasticities?
What will be an ideal response?
A normal rate of return on investment is equal to
A. accounting profit plus economic profit. B. total revenue plus total accounting profit C. accounting profit minus economic profit. D. the opportunity cost of capital plus any other implicit costs.