Graph the function f by starting with the graph of y = x2 and using transformations (shifting, compressing, stretching, and/or reflection).f(x) =  x2 + 6
A. 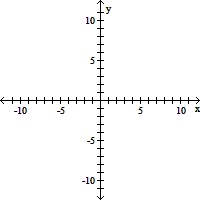
B. 
C. 
D. 
Answer: C
You might also like to view...
Identify the independent and dependent variables. Suppose that the speed of a car, measured in miles per hour (mph), is monitored for some short period of time after the driver applies the brakes. The following table and graph relate the speed of the car to the amount of time, measured in seconds (sec), elapsed from the moment that the brakes are applied.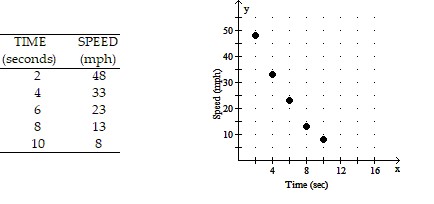
A. Independent: Speed in miles per hour Dependent: Time in seconds B. Independent: None Dependent: Speed in miles per hour, Time in seconds C. Independent: Time in seconds Dependent: Speed in miles per hour D. Independent: Speed in miles per hour, Time in seconds Dependent: None
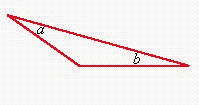
Find the measure of the third angle in the triangle, when 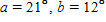 .
?
.
?
 ?
?
A. 
B. 
C. 
D. 
E. 
The mean weight of a group of boys is 170 lb, with a standard deviation of 20 lb. If the weights are normally distributed, what percent of the boys from the group weigh between 195 and 220 lb? Round your answer to one decimal place.
a. 39.4% b. 49.4% c. 88.8% d. 10.0% e. 11.2%
Write the expression in the standard form a + bi.Given z = 6 - 5i, evaluate z .
.
A. 11 B. 61 C. 36 - 25i D. 36 - 25i2