Determine whether the graph of the equation is a circle, parabola, ellipse, or hyperbola. Sketch the graph.(x + 1)2 + (y - 6)2 = 4
A. 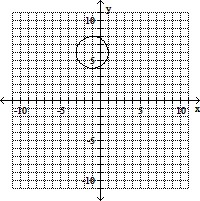
B. 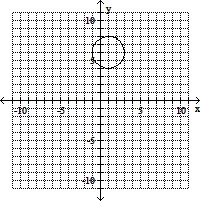
C. 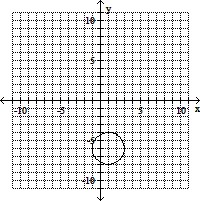
D. 
Answer: A
You might also like to view...
Use properties of logarithms to simplify.loge 1
A. 1 B. e C. 0 D. ?
Use an equation to solve the percent problem.24 is 6% of what number?
A. 144 B. 4000 C. 40 D. 400
Use a graphing calculator to plot the data and find the quadratic function of best fit.The number of housing starts in one beachside community has increased over the last eight years. The following data shows the number of housing starts over this period of time. Use a graphing calculator to plot a scatter diagram. What is the quadratic function of best fit? Round values to the nearest thousandth.
A. H(x) = -3.268x2 + 30.494x - 168.982 B. H(x) = 3.268x2 + 30.494x + 168.982 C. H(x) = -3.268x2 + 30.494x + 168.982 D. H(x) = -3.268x2 - 30.494x + 168.982
Find the open interval(s) where the function is changing as requested.Decreasing; f(x) = x3 - 4x
A. 
B. (-?, ?)
C. 
D. 