The following table shows the cumulative number of swine flu cases t days after an epidemic began.
 310172432
 2644128155177?
A. Calculate the average rate of change in the cumulative number of swine flu cases from day 17 to day 24.B. Explain in practical terms the meaning of the number you calculated in part A.C. Use your answer from part A to estimate the cumulative number of swine flu cases after 23 days. Round your answer to the nearest whole number.
What will be an ideal response?
A. 3.86 cases per day?B. From 17 to 24 days since the epidemic began, on average there were 3.86 new cases each day.?C. 151.00 cases
You might also like to view...
Solve the system of equations. Determine whether the system is consistent or inconsistent. If the system is consistent, state whether the equations are dependent or independent.4x - y = 1012x - 3y = 30
A. {(x, y)  }; consistent; dependent
B. (0, -10); consistent; independent
C. No solutions; inconsistent
D. (1, -6); consistent; independent
Graph the function by starting with the graph of the basic function and then using the techniques of shifting, compressing, stretching, and/or reflecting.f(x) = -|x|
A. 
B. 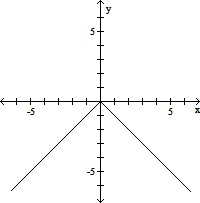
C. 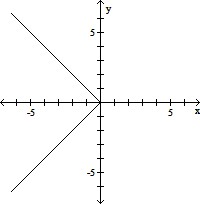
D. 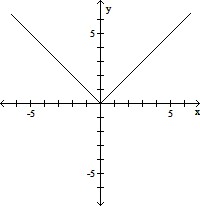
Use the two-stage method to solve.Maximizez = 18x1 + 12x2subject to:2x1 + 3x2 = 24 2x1 + x2 ? 45 2x1 + 3x2 ? 20 x1 ? 0, x2 ? 0
A. Maximum is 216 for x1 = 0, x2 = 8 B. Maximum is 216 for x1 = 12, x2 = 0 C. Maximum is 156 for x1 = 6, x2 = 4 D. Maximum is 186 for x1 = 9, x2 = 2
Determine if the type of relation is linear, nonlinear, or none.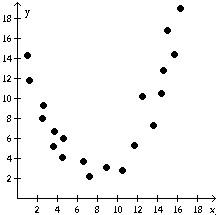
A. none B. linear C. nonlinear