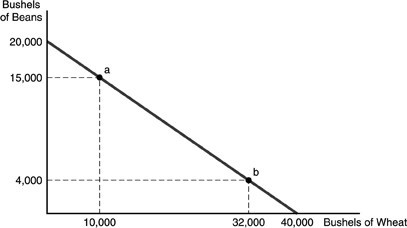
 Refer to the above figure. If the farmer is producing 4,000 bushels of beans and 38,000 bushels of wheat, then we know the farmer
A. is inefficient because point a is the most efficient point on the curve.
B. must be using more resources than were assumed available in constructing the graph.
C. is using resources efficiently.
D. is producing too much wheat.
Answer: B
You might also like to view...
The key distinction between risk and uncertainty is
a. Risk cannot be quantified, priced or traded b. Uncertainty refers to not knowing possible outcomes or their probabilities c. Uncertainty is modeled by listing the possible outcomes and assigning probabilities to the outcomes d. Risk has to do with not knowing the probability distribution of a random variable
Using aggregate demand and aggregate supply analysis, explain why increases in oil did not lead to stagflation in 2006–2008 but did lead to stagflation in the 1970s and early 1980s.
What will be an ideal response?
Suppose that demand is inelastic within a certain price range. For that price range,
a. an increase in price would increase total revenue because the decrease in quantity demanded is proportionately less than the increase in price. b. an increase in price would decrease total revenue because the decrease in quantity demanded is proportionately greater than the increase in price. c. a decrease in price would increase total revenue because the increase in quantity demanded is proportionately smaller than the decrease in price. d. a decrease in price would not affect total revenue.
All of the following would shift the LRAS curve to the right EXCEPT
A. a net inflow of human capital. B. an improvement in technology. C. an increase in the size of the labor force. D. an increase in the overall price level.