Use the information given to draw a bar graph. Clearly label the bars. The following table shows the average amount spent per week on groceries by four different families. Make a vertical bar graph to illustrate the data.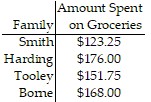
What will be an ideal response?
Answers may vary. The following is a possible answer.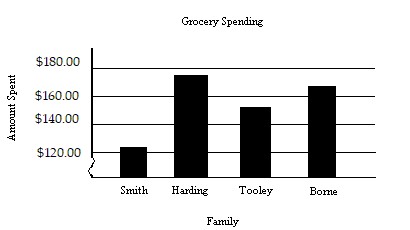
You might also like to view...
Solve the problem.Find an equation for the level surface of the function f(x, y, z) =  d? -
d? -  dt that passes through the point (0, ln 3, ln 4) .
A. ey + ez -  = -1
= -1
B. ey - ez +  = 1
= 1
C. ey + ez -  = 1
= 1
D. ey - ez +  = -1
= -1
Non-zero vectors v and w are given. Determine the vector decomposition of v into orthogonal components v1 and v2, where v1 is parallel to w and v2 is orthogonal to w.v = i + 2j; w = -3i + j
A. v1 =  i -
i -  j, v2 =
  i +
i +  j
j
B. v1 =  i -
i -  j, v2 =
  i +
i +  j
j
C. v1 =  i -
i -  j, v2 = -
  i +
i +  j
j
D. v1 =  i -
i -  j, v2 =
  i +
i +  j
j
Find the odds.A number cube labeled with numbers 1, 2, 3, 4, 5, and 6 is tossed. What are the odds in favor of the cube showing a number less than 3?
A. 1:1 B. 2:1 C. 1:3 D. 1:2
Simplify ?-18
What will be an ideal response?