Solve the problem.The graph depicts a relationship between scores achieved on an unspecified standardized test and family income. Suppose the score for a test is 485 when the family income is $25,000 and is 525 when the family income is $55,000. Let x be the income, in thousands, and y be the score of the test. Graph the two given pairs of incomes and scores. Assume that the relationship is linear. Draw a line though the two previous points. From your graph, estimates the score if the family income is $40,000. Label the axes, and show where the solution is located on the graph.
A. 
Standardized test score: 545
B. 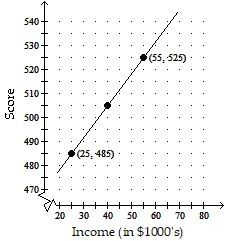
Standardized test score: 565
C. 
Standardized test score: 505
D. 
Standardized test score: 525
Answer: C
Mathematics
You might also like to view...
Give a geometric description of the set of points whose coordinates satisfy the given conditions.x = -6, z = 7
A. All points in the x-z plane B. The point (-6, 7) C. The line through the point (-6, 7, 0) and parallel to the z-axis D. The line through the point (-6, 0, 7) and parallel to the y-axis
Mathematics
Find the sum of the geometric series.
A. 186 B. 42 C. 255 D. 22
Mathematics
Provide an appropriate response.What are the domain and range for the equation y = 2x?
A. Domain: (0, ?); range: (-?, ?) B. Domain: (-?, ?); range: (0, ?) C. (-?, ?); range: [0, ?) D. Domain: (-?, ?); range: (-?, ?)
Mathematics
Add. + 15 + -3 + -1
A. 
B. 7
C. 13
D. 
Mathematics