Refer to the information provided in Figure 2.6 below to answer the question(s) that follow.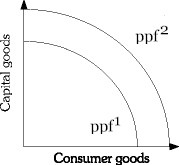 Figure 2.6Refer to Figure 2.6. If the economy is at ppf1, a change in consumer preferences would be shown by a
A. movement along ppf1.
B. movement along ppf2.
C. shift from ppf1 to ppf2.
D. shift from ppf2 to ppf1.
Answer: A
You might also like to view...
The natural rate hypothesis concludes that when the inflation rate unexpectedly increases, the unemployment rate ________
But when the higher inflation rate becomes the expected inflation rate, the unemployment rate then ________ until it reaches the ________ unemployment rate. A) decreases; decreases; natural B) increases; decreases; natural C) decreases; increases; natural D) increases; decreases; minimum E) decreases; increases; maximum
Which of the following correctly explains the role of economic agents in a free market?
A) Economic agents set production quotas for sellers in the market. B) Economic agents set prices according to the production cost of each good. C) Economic agents allocate goods to those buyers who need the goods the most. D) Economic agents allocate goods to those buyers who value the goods the most.
Because people consider government bonds to be part of their wealth, they
a. tend to overconsume and undersave b. tend to oversave and underconsume c. realize that taxes balance out the interest they earn from these bonds, and therefore do not change their levels of consumption and saving d. tend to try to buy more bonds because they are safe, interest-bearing assets, and therefore save more and consume less e. tend to assume that the taxes are also assessed on their interest income, and therefore oversave and underconsume
Which of the following refers to the positive or negative effect on parties who are not directly involved in a transaction?
A. Consumption effect B. Externality C. Incentive distortions D. Invisible hand