The graphs of two polynomials p and d are shown in the figure. p is represented by the solid line and d is represented by the dashed line. If f =  , (a) find the domain of f, (b) find the x-intercepts of f, and (c) sketch the graph of f.
A. (a) (-?, -2) ? (-2, ?)
(b) (-1, 0)
(c) 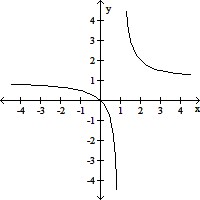
B. (a) (-?, 1) ? (1, ?)
(b) (2, 0)
(c) 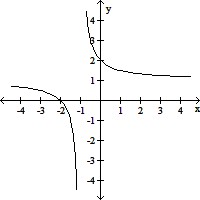
C. (a) (-?, -1) ? (-1, ?)
(b) (-2, 0)
(c) 
D. (a) (-?, -1) ? (-1, ?)
(b) (-2, 0)
(c) 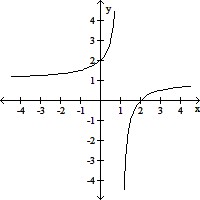
Answer: C
You might also like to view...
Solve the problem.A golden rectangle has a longer side of length 1000 ft. Which of the following numbers most closely represents the length of the shorter side of the rectangle?
A. 16.18 ft B. 618 ft C. 500 ft D. 1618 ft E. none of these
Provide an appropriate response.
What three-month period maintained a fairly constant sales record? 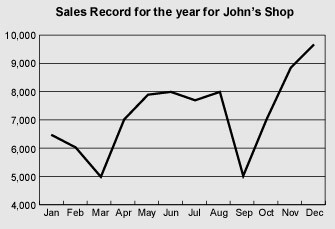
A. Apr-May-Jun B. Sep-Oct-Nov C. Feb-Mar-Sep D. May-Jun-Jul
Solve the problem.A rectangular patio has an area of 3m3 + 18m2 + 3m - 72. Find the length if the width is 3m + 9.
A. m2 - 3m + 8 B. m3 + 3m2 - 8m C. m2 + 13.5m - 8 D. m2 + 3m - 8
Solve using Cramer's rule.
A. (0, -5) B. (1, -6) C. (-1, -5) D. No solution