An ______ is a graphical representation that shows the positive relationship between price and quantity provided.
a. individual supply curve
b. individual demand curve
c. individual equilibrium curve
d. individual surplus curve
a. individual supply curve
You might also like to view...
When interest rates fall, a bank that perfectly hedges its portfolio of Treasury securities in the futures market
A) suffers a loss. B) experiences a gain. C) has no change in its income. D) may either gain, lose or see no change in its income.
The figure below shows the demand for items from a warehouse club. All of the people who shop at the warehouse club have the same demand. If the managers set a single price, so that all customers pay the same price for every item they buy, the firm makes an economic profit of ________ and if the managers use two-part pricing, the firm makes an economic profit of ________.
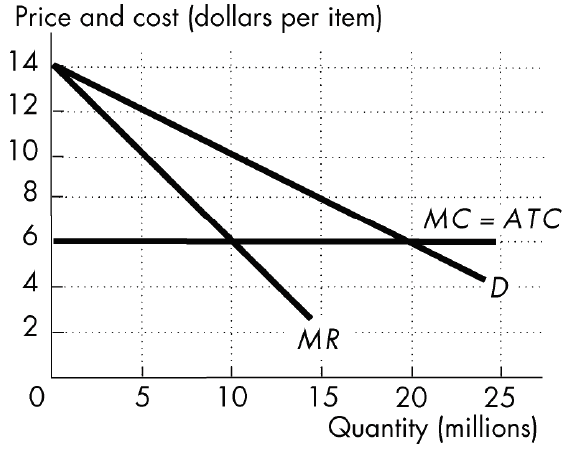
A) $40 million; $80 million
B) $60 million; $80 million
C) $40 million; $60 million
D) $0; $80 million
In the equation of exchange, GDP divided by the money supply is equal to
A) M. B) V. C) P. D) Q.
Suppose that a particular industry has a four-firm concentration ratio of 85 and a Herfindahl index of 3,000. Most likely, this industry would achieve:
A. both productive efficiency and allocative efficiency. B. allocative efficiency but not productive efficiency. C. neither productive efficiency nor allocative efficiency. D. productive efficiency but not allocative efficiency.