Exhibit 10-3 Aggregate supply and demand curves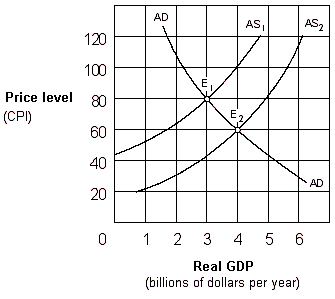
In Exhibit 10-3, the change in equilibrium from E1 to E2 represents:
A. deflation.
B. demand-pull inflation.
C. price-push inflation.
D. cost-push inflation.
Answer: A
You might also like to view...
When the government uses a private subsidy in a market with an external benefit, to reach the efficient quantity of production, the subsidy must be equal to the marginal
A) social benefit. B) cost of production. C) private benefit. D) external benefit. E) external cost.
If someone has a high willingness to take on situations with risk, he is considered:
A. low-risk. B. high-compensation. C. risk-seeking. D. risk-averse.
Which of the following entities actually executes open-market operations?
a. the Board of Governors b. the New York Federal Reserve Bank c. the Federal Open Market Committee d. the Open Market Committees of the regional Federal Reserve Banks
For wages to be higher without sacrificing jobs, productivity must decrease.
Answer the following statement true (T) or false (F)