Use this graph to answer the question.Big "D" Sales for Year 1, Year 2 

 MonthWhat were the total sales for Year 2?
A. $60,000
B. $72,000
C. $578,000
D. $764,000
Answer: D
Mathematics
You might also like to view...
Graph the numbers on the real number line.x < -6![]()
A. ![]()
B. ![]()
C. ![]()
D. ![]()
Mathematics
Solve the problem.This chart shows the fees for an 18-hole round of golf for each of the last 5 years at a local municipal golf course. Assume that this chart defines a function with the name of f. Find f(2010).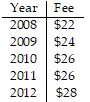
A. $24 B. $26 C. $22 D. $28
Mathematics
Find the range of the quadratic function.f(x) = -7(x - 5)2 - 7
A. [-7, ?) B. [-5, ?) C. (-?, -7] D. (-?, 5]
Mathematics
Use translations of one of the basic functions defined by y = x2, y = x3, y =  , or y =
  to sketch a graph of y = f(x) by hand. Do not use a calculator.y = ?x - 3?
A. 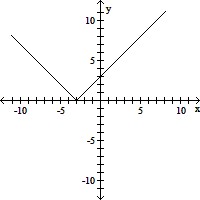
B. 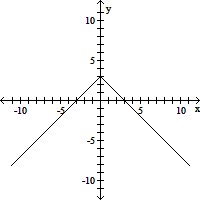
C. 
D. 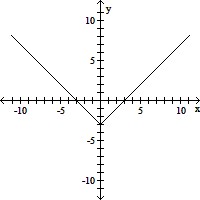
Mathematics