Graph the function f(x) over the given interval. Partition the interval into 4 subintervals of equal length. Then add to your sketch the rectangles associated with the Riemann sum  , using the indicated point in the kth subinterval for ck.f(x) = x2 - 1, [0, 8], left-hand endpoint
A. 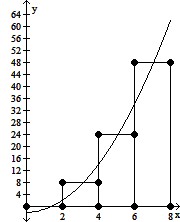
B. 
C. 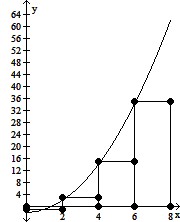
D. 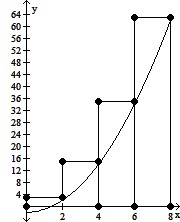
Answer: C
You might also like to view...
Like many major rivals, Coca-Cola and Pepsi-Cola compete with each other internationally in order to prevent the other from gaining a significant advantage in any one country or region that it could exploit in the U.S. market.
Answer the following statement true (T) or false (F)
Solve the linear inequality. Graph the solution set on a number line, and express the solution using interval notation. x ? 5 +
  x
x![]()
A. [18, ?)![]()
B. (-?, 18]![]()
C. (18, ?)![]()
D. [-18, ?)![]()
Solve.Ron and Kathy are ticket sellers at their class play, Ron selling student tickets for $2.00 each and Kathy selling adult tickets for $4.50 each. If their total income for 364 tickets was $1175.50, then how many tickets did Ron sell?
A. 185 tickets B. 179 tickets C. 157 tickets D. 163 tickets
If  is a root of
  , use synthetic division to factor the polynomial completely and list all real solutions of the equation.
A. 
B. 
C. 
D. 
E.