Provide an appropriate response. Shortly before a mayoral election, a market research firm took a poll to find out which candidate people were planning to vote for. The results are shown below.  Li Fong2120Bob Green2329Sue Moore1042Jose Alvarez399You wish to construct a graph to represent the data. It should be easy to see from your graph which candidate is in the lead. Which graph would be more useful, a bar graph or a pie chart? Explain your thinking.
What will be an ideal response?
Answers will vary. Possible answer: A bar graph would be more useful. A bar graph is useful for comparing the sizes of different categories with each other, since it is easy to compare the heights of different bars.
You might also like to view...
Find the amount that results from the investment.$1,000 invested at 10% compounded annually after a period of 7 years
A. $1771.56 B. $1948.72 C. $2143.59 D. $948.72
Use the properties of limits to help decide whether each limit exits. If a limit exists, find its value. Let f(x) =
 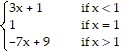 . Find
 f(x).
f(x).
A. 4 B. 0 C. 2 D. Does not exist
The table lists the approximate value V of a mid-sized sedan for the years 2003 through 2009. The variable t represents the time in years, with src="https://sciemce.com/media/2/ppg__cognero__Section_5.4__media__0a5bda2a-f1f3-4208-b375-3f794a32df6f.PNG" class="wirisformula" align="middle" style="vertical-align: middle;" data-wiris-created="true" varid="variable_id_field" variablename="impvar_72eb78ef49234b169ebdd3df8" />. Round your answer to two decimal places. corresponding to 2003. Find the rate of change in the value of the sedan when
  using the exponential model
?
h 3456789p $ 25,046$21,596 $19,851 $17,001 $14,226$12,101 $10,841?
?
A.  dollars/year
B.  dollars/year
C.  dollars/year
D.  dollars/year
E.  dollars/year
Evaluate the exponential. -1/2
-1/2
A. 
B. - 
C. not a real number
D. 