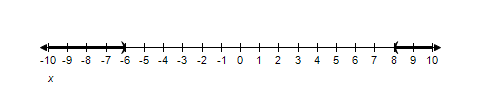
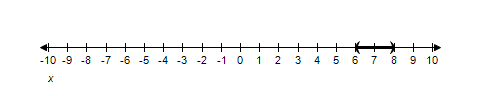
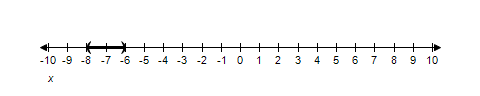
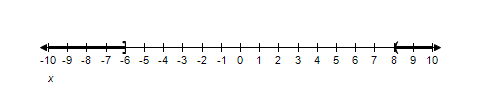
Solve the inequality and graph the solution on the real number line.
?

?
A. 
B.

C.

D.

E.


Answer: A
You might also like to view...
Find the volume by using polar coordinates.The region bounded by the paraboloid  and the xy-plane
A. 324? B. 648? C. 216? D. 432?
Solve the problem.Find the moment of inertia Iy of a tetrahedron of constant density  bounded by the coordinate planes and the plane
  .
.
A. 
B. 
C. 
D. 
The following table shows the earnings for the Juarez family last year. Use this information to answer the question.MonthEarningsMonthEarningsJan.$1400July$1300Feb.$1150Aug.$2450Mar.$2950Sept.$2500Apr.$2300Oct.$2000May$1650Nov.$2350June$2700Dec.$2400What was the family's total income from January thru June?
A. $11,000 B. $9,200 C. $12,150 D. $13,000
Suppose that demographic studies show that each year about 8% of a city's population moves to the suburbs (and 92% stays in the city), while 4% of the suburban population moves to the city (and 96% remains in the suburbs). In the year 2000, 64
1% of the population of the region lived in the city and 35.9% lived in the suburbs. What percentage of the population of the region would eventually live in the city if the migration probabilities were to remain constant over many years? For simplicity, ignore other influences on the population such as births, deaths, and migration into and out of the region. A) 41.7% B) 33.3% C) 50% D) 66.7%