The table shows, for some particular year, a listing of several income levels and, for each level, the proportion of the population in the level and the probability that a person in that level bought a new car during the year. Given that one of the people who bought a new car during that year is randomly selected, find the probability that that person was in the indicated income category. Round your answer to the nearest hundredth. 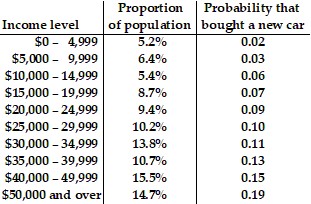 $35,000 - $39,999
A. 0.09
B. 0.13
C. 0.11
D. 0.15
Answer: B
Mathematics
You might also like to view...
Use the properties of logarithms to evaluate the expression without the use of a calculator.log55
A. 1
B. 0
C. 5
D. 
Mathematics
Graph the equation by plotting points.y = x3 
A. 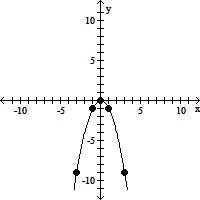
B. 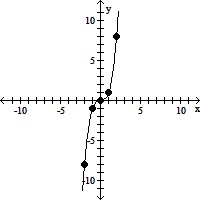
C. 
D. 
Mathematics
Solve the problem.Bob owns a watch repair shop. He has found that the cost of operating his shop is given by 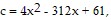 where c is the cost in dollars, and x is the number of watches repaired. How many watches must he repair to have the lowest cost?
A. 39 watches B. 61 watches C. 40 watches D. 30 watches
Mathematics
Simplify the complex rational expression.
A. 
B. 
C. x - 9
D. -9
Mathematics