Find all values of p for which the series  FIGURE 1.png) converges.
converges.
What will be an ideal response?
p > 1
You might also like to view...
Provide an appropriate response.Suppose that you want to construct a graph to represent the following data. 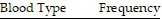 O90A84B18AB8If you are mostly interested in the number of people in each category as a percentage of the total number of people, would a bar chart or a pie chart be more useful? Explain your thinking.
What will be an ideal response?
Find the absolute value of the number.
Fill in the blank(s) with the appropriate word(s).
Provide an appropriate response.Write 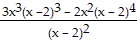 with positive exponents only, and as a single fraction reduced to lowest terms.
What will be an ideal response?
Solve the problem.The graph below shows the number of tuberculosis deaths in the United States from 1989 to 1998.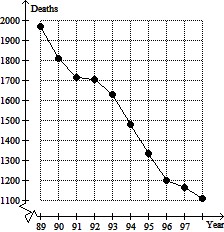 Estimate the average rate of change in tuberculosis deaths from 1991 to 1996.
A. About -60 deaths per year B. About -.9 deaths per year C. About -100 deaths per year D. About -500 deaths per year