Use the figure below to answer the following question.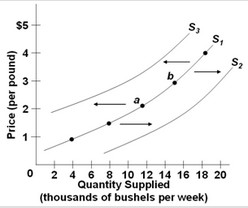 The figure above shows three supply curves for wheat. Which of the following would cause the quantity of wheat supplied to increase from point a to point b?
A. a tax on wheat production
B. an increase in the price of wheat
C. a decrease in the price of wheat
D. a subsidy for wheat production
Answer: B
You might also like to view...
Which of the following makes short-term conditional low-interest loans to LDCs?
a. Agency for International Development (AID) b. World Bank c. Agency for International Finance (AIF) d. International Monetary Fund (IMF)
Types of unemployment:
A) Structural unemployment B) Frictional unemployment C) Seasonal unemployment D) All of the above
The supporters of a proposal to increase marginal taxes on those earning over $100,000 a year say this change would generate $500 million in new tax revenues. A supply-side economist would argue that the actual revenue raised will be
A. less than $500 million because some people will respond by working less. B. more than $500 million because interest rates will also be affected. C. more than $500 million, because lower income people will work harder when they perceive the tax system to be fairer. D. exactly $500 million because there are no offsetting factors to a tax increase.
Demand is inelastic when
A. the percentage change in quantity demanded is greater than percentage change in price. B. the percentage change in price is greater than percentage change in quantity. C. the percentage change in price is equal to percentage change in quantity.