Determine which region, I through VII, the indicated element belongs.The chart that follows shows people's loyalty to specific grocery stores. In the Venn diagram given, the set indicated as Year 1 represents the set of grocery stores listed in the table under Year 1, and so on.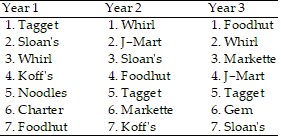
 Charter
A. VI
B. IV
C. I
D. II
Answer: C
You might also like to view...
Find the absolute maxima and minima of the function on the given domain. on the trapezoidal region with vertices

 and
and 
A. Absolute maximum: 10 at  absolute minimum: 0 at
B. Absolute maximum: 10 at  absolute minimum: 7 at
C. Absolute maximum: 6 at  absolute minimum: 0 at
D. Absolute maximum: 14 at  absolute minimum: 7 at
Find the center of mass of a thin plate of constant density covering the given region.The region between the curve y =  and the x-axis from
  to
to 
A.  =
=  ,
,  =
=  ln 36
ln 36
B.  =
=  ,
,  =
=  ln 36
ln 36
C.  = 860,
  = 36 ln 36
D.  =
=  ln 36,
  =
= 
Graph the function.y = csc 
A. 
B. 
C. 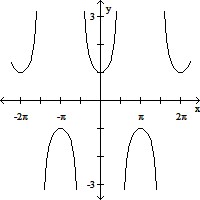
D. 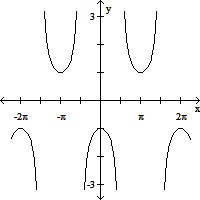
Solve the exponential equation by taking the logarithm on both sides. Use a calculator to obtain a decimal approximation, correct to four decimal places, for the solution.e(x + 7) = 2
A. -6.0837 B. 2.1972 C. -4.8028 D. -6.3069