Refer to Figure 12-1. If the firm is producing 500 units, what is the amount of its profit or loss?
A) profit equivalent to the area A
B) loss equivalent to the area A
C) profit of $280
D) There is insufficient information to answer the question.
D
You might also like to view...
Which of the following trends has been occurring with mandatory spending?
a. People are receiving fewer benefits per person. b. The number of undocumented immigrants receiving benefits has ballooned dramatically. c. The number of workers is decreasing compared to the number of people getting benefits. d. People are becoming more reluctant to apply for benefits.
Exhibit 4-6 Demand and supply curves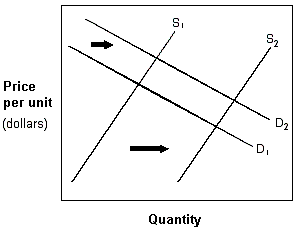 If the market demand and supply curves shift as given in Exhibit 4-6, the resulting new equilibrium will show a(n):
A. increase in market price and a decrease in the quantity exchanged. B. decrease in market price and a decrease in the quantity exchanged. C. increase in market price and an increase in the quantity exchanged. D. decrease in market price and an increase in the quantity exchanged.
Which of the following stock market decreases is best explained by the notion of a bubble collapsing?
A. The U.S. stock market in technology stocks in 2000 B. The early-1982 drop in the DJIA C. The U.S. stock market's drop in late 2008 D. The decade of the 1970s
When the price level is below the level at which the aggregate demand curve crosses the long run aggregate supply curve
A. there will be pressures that will lead to a shift of either the aggregate demand or the long run aggregate supply curves. B. total planned real expenditure will be lower than actual real GDP, and the price level will increase. C. total planned real expenditures will exceed actual real GDP, and the price level will increase. D. there will be no price level change.