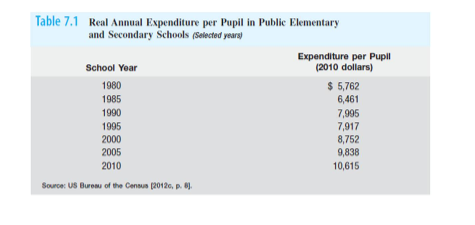
 Refer to the above graph. Which line shows the full-employment output for the economy?
A. 1
B. 2
C. 3
D. 4
Answer: D
You might also like to view...
Which of the following is TRUE of trends in the number of new U.S. patents?
A) There was a steady increase in new patents throughout the 1970s. B) The number of new patents granted each year has remained unchanged since the early 1970s. C) The number of new patents granted each year declined by more than 50 percent after 2001. D) There was a surge in new patents in the latter part of the 1990s.
The Malthusian model performs poorly in explaining economic growth after the
A) French Revolution. B) American Revolution. C) Industrial Revolution. D) Bio-technology Revolution.
Any price ______ will cause the firm to shut down production.
A. below the minimum of MC B. above the maximum of AC C. below the minimum of AC D. between MC and AC
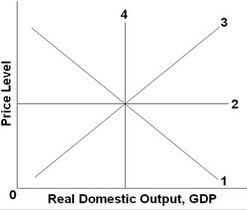
Refer to Table 7.1 below. By what percentage does real annual expenditures in public elementary and secondary schools rise between 1980 and 1985? Between 2005 and 2010? What can be said about the rate of change?