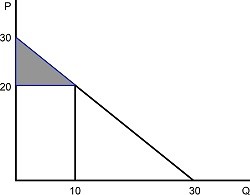
 Figure 6.1In Figure 6.1, the price of the good is $20 and the shaded area represents:
A. producer surplus.
B. consumer surplus.
C. market equilibrium.
D. a price ceiling.
Answer: B
You might also like to view...
The French Bakery ran a special which decreased the price of its croissants from $1.50 to $1.00. Although her money income had not changed, Toni decided to buy 2 croissants instead of her usual 1 bagel and 1 croissant
Toni's actions are explained by which of the following? A) income and substitution effects B) price effect C) consumption effect D) income effect only or substitution effect only but not both effects
Find the real exchange rate for the following case: Assume that the representative basket of European goods costs 100 euros and the representative U.S. basket costs $125,
and the dollar/euro exchange rate is $0.75 per euro, then the price of the European basket in terms of U.S. basket is:
Which of the following is correct?
a. Countries with the highest growth rates over the last 120 years are the ones that had the highest level of real GDP 120 years ago. b. Most countries have had little fluctuation around their average growth rates during the past 120 years. c. The ranking of countries by income changes little over time. d. Even though Japan had a higher growth rate of real GDP per person than the U.S. over the last 120 years, it's level of real GDP per person is less than that of the U.S.
The government's running of a deficit or a surplus with the objective of affecting the level of output in the economy is called:
A. sound finance. B. the Ricardian equivalence. C. fiscal policy. D. public finance.