A supply curve is a graphical illustration of the relationship between price, shown on the vertical axis, and ____________, shown on the horizontal axis.
A. demand
B. quantity
C. quantity supplied
D. quantity demanded
Answer: B. quantity
You might also like to view...
Which of the following will decrease aggregate demand?
a. exports rising faster than imports b. exports falling faster than imports c. exports rising the same amount as imports d. exports rising and imports falling
Our rate of productivity growth in the 1990s was _____ compared to the rate of our productivity growth during the 1970s.
Fill in the blank(s) with the appropriate word(s).
Labor demand is more elastic the greater the elasticity of demand for the firm's output because
A. capital is usually price elastic. B. the firm will want to hire fewer workers when the wage rate increases. C. a firm that operates in a competitive output market cannot lower its price. D. the firm's output price falls when the firm produces less output. E. the firm would see its quantity demanded fall substantially if the firm tried to pass increased labor costs through to the consumer by increasing the price of the output good.
Based on this figure, if an exchange rate of $0.09 dollars per Norwegian krone is maintained, the Norwegian government will gain (in dollar) ________ worth of international reserves per period.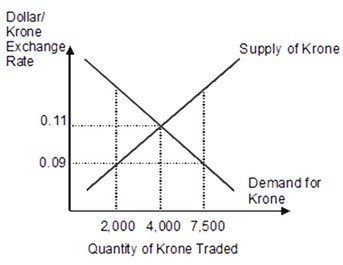
A. 495 B. 605 C. 5,500 D. 220