The table shows, for some particular year, a listing of several income levels and, for each level, the proportion of the population in the level and the probability that a person in that level bought a new car during the year. Given that one of the people who bought a new car during that year is randomly selected, find the probability that that person was in the indicated income category. Round your answer to the nearest hundredth. 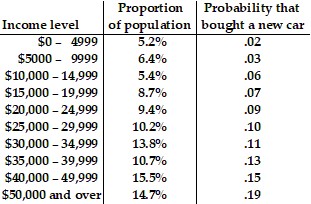 $15,000 - $19,999
A. .08
B. .05
C. .04
D. .07
Answer: B
Mathematics
You might also like to view...
Determine the period of the function and sketch its graph.y = cos 
A. period: 6?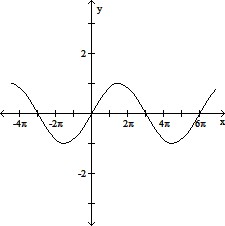
B. period: 3?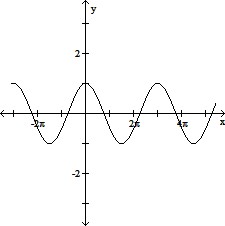
C. period: 6?
D. period: 6
Mathematics
Divide.
A. 0.35 B. 0.36 C. 3.5 D. 0.036
Mathematics
Find the point (x, y) on the unit circle that corresponds to the real number t.
?
 ?
?
A.  corresponds to the point
  .
.
B.  corresponds to the point
  .
.
C.  corresponds to the point
  .
.
D.  corresponds to the point
  .
.
E.  corresponds to the point
  .
.
Mathematics
Solve the equation.s = 128 + 8
A. {512} B. {192} C. {256} D. {128}
Mathematics